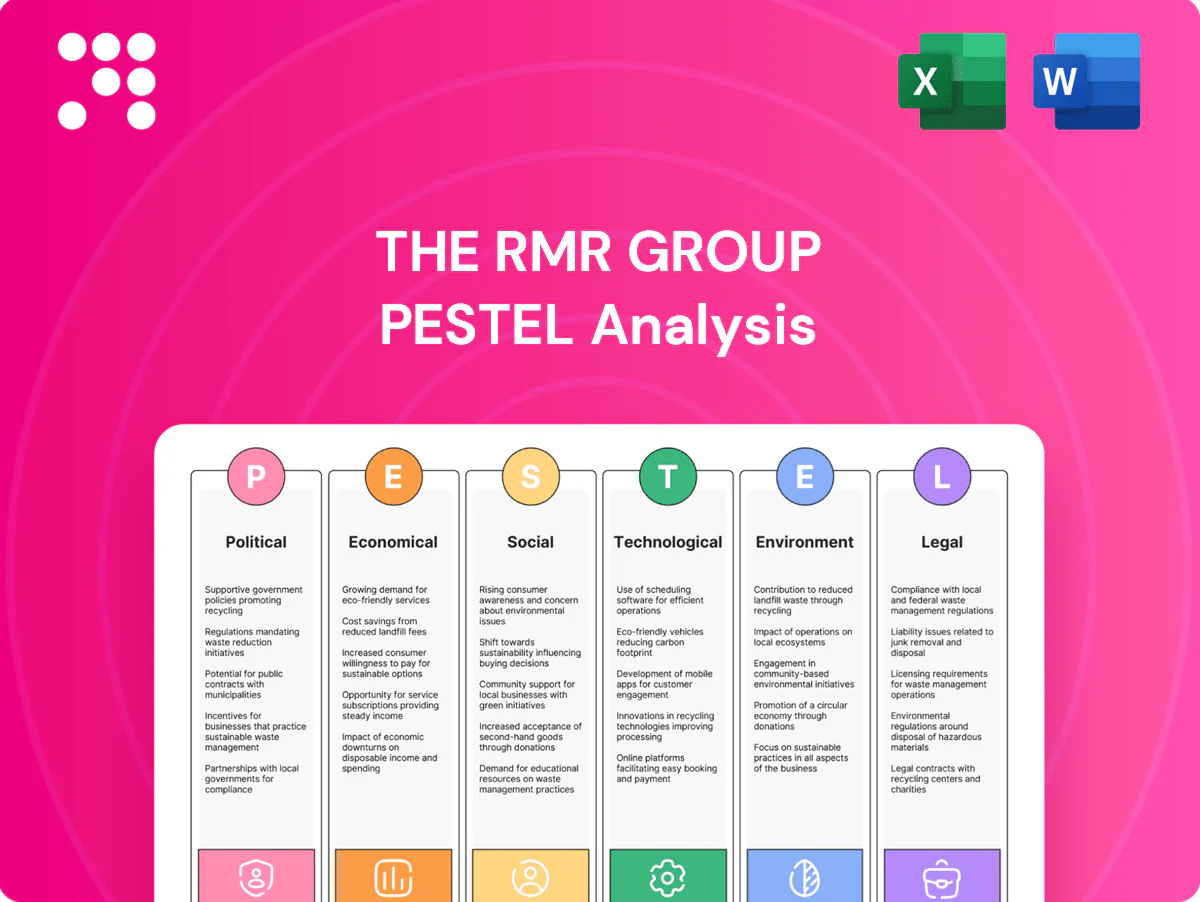
The RMR Group PESTLE Analysis
Skip the Research. Get the Strategy.
Gain strategic clarity with our PESTLE analysis of The RMR Group—uncover how political, economic, social, technological, legal and environmental forces are reshaping its prospects. Ideal for investors and strategists, this concise briefing highlights risks and growth levers. Purchase the full report to access detailed, actionable insights and ready-to-use slides for immediate decision-making.
Political factors
Zoning and land-use regimes
Local and regional zoning decisions determine permitted uses and repositioning potential across office, industrial, retail, and lodging assets, directly affecting revenue trajectories for RMR-managed properties. Changes to density allowances, mixed-use overlays, or temporary moratoria can either unlock fee-generating development or stall leasing and repositioning plans. Active engagement with planning authorities and community stakeholders is essential to anticipate entitlement risk. RMR’s asset strategies must remain flexible to shifting municipal priorities and NIMBY dynamics.
Infrastructure and public investment
Federal and state public investment shapes RMR Group asset accessibility: the Bipartisan Infrastructure Law committed roughly 1.2 trillion USD to roads, transit and ports, while the BEAD broadband program allocates 42.45 billion USD and the NEVI electric vehicle program about 5 billion USD, lifting tenant demand and rent trajectories near upgraded nodes. Priority corridors funded by these programs can catalyze industrial and office clusters, boosting management and leasing fees, whereas delays or budget cuts stall revitalization and leasing momentum. Tracking federal and state policy pipelines lets RMR align capital allocation with emerging high-growth nodes and minimize vacancy risk.

Tax policy and incentives
Shifts in property taxes, federal depreciation tweaks and state/local incentives materially affect RMR Group portfolios, where a 100-basis-point local tax increase can compress net operating income and cap-rate valuations; RMR manages roughly $37 billion in real estate-related assets (2024). Targeted abatements or TIFs boost redevelopment returns and fee pools, while municipal tax hikes to cover deficits can pressure occupancies and valuations; proactive tax structuring across jurisdictions mitigates exposure.
Political stability and lobbying climate
Political stability lowers regulatory volatility for publicly traded REITs and managers like RMR, while changing leadership can shift labor rules, energy standards and permitting timelines that affect property operations; the US federal funds rate was 5.25–5.50% in mid‑2025, tightening financing and operational costs. Industry lobbying materially influences like‑kind exchanges, carried interest and REIT rules, and balanced advocacy helps safeguard the asset‑management fee base.
- Stable governance: fewer regulatory shocks
- Leadership change: affects labor, energy, permitting
- Lobbying: impacts 1031, carried interest, REIT tax rules
- Advocacy: protects asset‑management fees
Trade and geopolitics
Global tensions disrupt supply chains for building materials and FF&E, squeezing capex and pushing renovation timelines; US Section 232 tariffs (25% steel, 10% aluminum) remain a direct cost driver for projects. Tariffs and import restrictions increase project costs and delivery lead times, while markets with heavy exposure to trade-sensitive tenants such as logistics and manufacturing see volatile demand. Scenario planning underpins resilient leasing and CAPEX phasing.
- 25% steel / 10% aluminum tariffs elevate material costs
- Trade disruptions extend FF&E lead times, delaying renovations
- Logistics/manufacturing tenant exposure amplifies demand swings
- Scenario planning supports adaptive leasing and capex timing
Policy, tariffs and 5.25–5.50% rates hit NOI, capex and repositioning of 37B RE
Local zoning, tax changes and federal/state infrastructure funding (BIL ~1.2T, BEAD 42.45B, NEVI ~5B) directly alter RMR’s repositioning, NOI and fee pools across its ~37B real‑estate portfolio (2024). Tariffs (25% steel/10% aluminum) and global tensions raise capex and delay projects, while political leadership shifts affect permitting, labor and energy rules amid a 5.25–5.50% fed funds rate (mid‑2025).
| Factor | Impact | Metric |
|---|---|---|
| Zoning/taxes | Valuation/NORI risk | 100bps tax = NOI pressure |
| Infrastructure | Demand lift | BIL 1.2T/BEAD 42.45B |
| Tariffs | Capex ↑ | Steel 25%/Al 10% |
What is included in the product
Explores how external macro-environmental factors uniquely affect The RMR Group across Political, Economic, Social, Technological, Environmental, and Legal dimensions, with each section backed by relevant data and trends to identify risks and opportunities; designed for executives and investors to support strategic planning and funding decisions.
The RMR Group PESTLE Analysis delivers a concise, visually segmented summary of political, economic, social, technological, legal and environmental drivers—easy to drop into presentations, annotate for local context, and share across teams to streamline risk discussions and strategic planning.
Economic factors
Interest rates and cap rates
Policy rates near 5.25–5.50% in 2024 pushed borrowing costs higher, lifting cap rates and marking down valuations across RMR-managed portfolios; 10-year Treasury yields hovering around 4% in 2024–25 further tightened pricing. Rising rates curtailed transaction volumes and fee-based AUM growth, while falling rates historically unlock refinancing and deal flow. Lodging and office remain most rate-reactive. Active hedging and duration management are used to stabilize earnings.
Labor markets and occupancy
Employment trends—US unemployment 3.7% (Dec 2024, BLS)—drive space absorption: national office vacancy ~16% vs industrial ~4.5% (CoStar 2024), influencing rents and renewals. Tight labor markets bolster consumer spending and hotel RevPAR recovery, while slackness pressures leasing. Tenant sector rotation shifts demand across subtypes/geographies, and data-driven leasing identifies local growth pockets despite macro noise.

Inflation and operating costs
Inflation (US CPI ~3.4% in 2024) lifts utilities, insurance, payroll and repairs, squeezing RMR property-level margins; CPI-linked escalators and percentage rents often recover part of cost growth. Post-pandemic supply-chain bottlenecks pushed repositioning and TI capex roughly 15–25% higher in 2023–24. Aggressive expense management and procurement scale have driven fee-margin gains of ~50–100 bps.
Capital markets liquidity
Capital markets liquidity governs RMR Group acquisition, disposition and recapitalization pipelines: liquid equity/debt markets in 2024–H1 2025 (global equity cap >100 trillion USD; US 10y ~4.2%) expanded transactions and AUM, while frozen credit windows reduced performance fees and advisory mandates.
- Spread volatility: IG spreads ~120bp, HY ~450bp — ups tenant credit/leasing risk
- Diversified funding preserves execution through cycles
Cyclical demand in lodging and retail
Travel budgets and consumer sentiment drive lodging occupancy and ADR, amplifying cyclicality; STR showed US occupancy near 64% in 2023 with RevPAR approaching 2019 levels by 2024, intensifying fee swings. Retail sales and a ~20% e-commerce share in 2024 reweight tenant stability and renewals. Diversification into necessity retail and select-service hotels and dynamic pricing/asset-mix realignment can smooth fee volatility and enhance resilience.
- Travel sensitivity: RevPAR volatility
- Retail shift: ~20% e-commerce
- Diversify: necessity retail, select-service
- Actions: dynamic pricing, asset realign
Policy, tariffs and 5.25–5.50% rates hit NOI, capex and repositioning of 37B RE
Rising policy rates (Fed 2024 target 5.25–5.50%) and 10y Treasury ~4.2% (H1 2025) lifted cap rates, cutting valuations and deal volumes; tight credit (IG ~120bp, HY ~450bp) raised tenant risk. US unemployment 3.7% (Dec 2024) and CPI ~3.4% (2024) supported consumer demand and hotel RevPAR recovery; e-commerce ~20% (2024) reshapes retail mix, while fee margins improved ~50–100bp via cost control.
| Metric | Value |
|---|---|
| Fed policy rate 2024 | 5.25–5.50% |
| 10y Treasury H1 2025 | ~4.2% |
| Unemployment (Dec 2024) | 3.7% |
| CPI 2024 | ~3.4% |
| IG/HY spreads | ~120bp / ~450bp |
| E‑commerce 2024 | ~20% |
Preview Before You Purchase
The RMR Group PESTLE Analysis
The preview shown here is the exact PESTLE analysis of The RMR Group you’ll receive after purchase—fully formatted and ready to use. It provides concise coverage of political, economic, social, technological, legal, and environmental drivers affecting RMR Group’s strategy and operations. No placeholders or teasers—this is the final, professionally structured document available for immediate download.

Description
Skip the Research. Get the Strategy.
Gain strategic clarity with our PESTLE analysis of The RMR Group—uncover how political, economic, social, technological, legal and environmental forces are reshaping its prospects. Ideal for investors and strategists, this concise briefing highlights risks and growth levers. Purchase the full report to access detailed, actionable insights and ready-to-use slides for immediate decision-making.
Political factors
Zoning and land-use regimes
Local and regional zoning decisions determine permitted uses and repositioning potential across office, industrial, retail, and lodging assets, directly affecting revenue trajectories for RMR-managed properties. Changes to density allowances, mixed-use overlays, or temporary moratoria can either unlock fee-generating development or stall leasing and repositioning plans. Active engagement with planning authorities and community stakeholders is essential to anticipate entitlement risk. RMR’s asset strategies must remain flexible to shifting municipal priorities and NIMBY dynamics.
Infrastructure and public investment
Federal and state public investment shapes RMR Group asset accessibility: the Bipartisan Infrastructure Law committed roughly 1.2 trillion USD to roads, transit and ports, while the BEAD broadband program allocates 42.45 billion USD and the NEVI electric vehicle program about 5 billion USD, lifting tenant demand and rent trajectories near upgraded nodes. Priority corridors funded by these programs can catalyze industrial and office clusters, boosting management and leasing fees, whereas delays or budget cuts stall revitalization and leasing momentum. Tracking federal and state policy pipelines lets RMR align capital allocation with emerging high-growth nodes and minimize vacancy risk.
Tax policy and incentives
Shifts in property taxes, federal depreciation tweaks and state/local incentives materially affect RMR Group portfolios, where a 100-basis-point local tax increase can compress net operating income and cap-rate valuations; RMR manages roughly $37 billion in real estate-related assets (2024). Targeted abatements or TIFs boost redevelopment returns and fee pools, while municipal tax hikes to cover deficits can pressure occupancies and valuations; proactive tax structuring across jurisdictions mitigates exposure.
Political stability and lobbying climate
Political stability lowers regulatory volatility for publicly traded REITs and managers like RMR, while changing leadership can shift labor rules, energy standards and permitting timelines that affect property operations; the US federal funds rate was 5.25–5.50% in mid‑2025, tightening financing and operational costs. Industry lobbying materially influences like‑kind exchanges, carried interest and REIT rules, and balanced advocacy helps safeguard the asset‑management fee base.
- Stable governance: fewer regulatory shocks
- Leadership change: affects labor, energy, permitting
- Lobbying: impacts 1031, carried interest, REIT tax rules
- Advocacy: protects asset‑management fees
Trade and geopolitics
Global tensions disrupt supply chains for building materials and FF&E, squeezing capex and pushing renovation timelines; US Section 232 tariffs (25% steel, 10% aluminum) remain a direct cost driver for projects. Tariffs and import restrictions increase project costs and delivery lead times, while markets with heavy exposure to trade-sensitive tenants such as logistics and manufacturing see volatile demand. Scenario planning underpins resilient leasing and CAPEX phasing.
- 25% steel / 10% aluminum tariffs elevate material costs
- Trade disruptions extend FF&E lead times, delaying renovations
- Logistics/manufacturing tenant exposure amplifies demand swings
- Scenario planning supports adaptive leasing and capex timing
Policy, tariffs and 5.25–5.50% rates hit NOI, capex and repositioning of 37B RE
Local zoning, tax changes and federal/state infrastructure funding (BIL ~1.2T, BEAD 42.45B, NEVI ~5B) directly alter RMR’s repositioning, NOI and fee pools across its ~37B real‑estate portfolio (2024). Tariffs (25% steel/10% aluminum) and global tensions raise capex and delay projects, while political leadership shifts affect permitting, labor and energy rules amid a 5.25–5.50% fed funds rate (mid‑2025).
| Factor | Impact | Metric |
|---|---|---|
| Zoning/taxes | Valuation/NORI risk | 100bps tax = NOI pressure |
| Infrastructure | Demand lift | BIL 1.2T/BEAD 42.45B |
| Tariffs | Capex ↑ | Steel 25%/Al 10% |
What is included in the product
Explores how external macro-environmental factors uniquely affect The RMR Group across Political, Economic, Social, Technological, Environmental, and Legal dimensions, with each section backed by relevant data and trends to identify risks and opportunities; designed for executives and investors to support strategic planning and funding decisions.
The RMR Group PESTLE Analysis delivers a concise, visually segmented summary of political, economic, social, technological, legal and environmental drivers—easy to drop into presentations, annotate for local context, and share across teams to streamline risk discussions and strategic planning.
Economic factors
Interest rates and cap rates
Policy rates near 5.25–5.50% in 2024 pushed borrowing costs higher, lifting cap rates and marking down valuations across RMR-managed portfolios; 10-year Treasury yields hovering around 4% in 2024–25 further tightened pricing. Rising rates curtailed transaction volumes and fee-based AUM growth, while falling rates historically unlock refinancing and deal flow. Lodging and office remain most rate-reactive. Active hedging and duration management are used to stabilize earnings.
Labor markets and occupancy
Employment trends—US unemployment 3.7% (Dec 2024, BLS)—drive space absorption: national office vacancy ~16% vs industrial ~4.5% (CoStar 2024), influencing rents and renewals. Tight labor markets bolster consumer spending and hotel RevPAR recovery, while slackness pressures leasing. Tenant sector rotation shifts demand across subtypes/geographies, and data-driven leasing identifies local growth pockets despite macro noise.
Inflation and operating costs
Inflation (US CPI ~3.4% in 2024) lifts utilities, insurance, payroll and repairs, squeezing RMR property-level margins; CPI-linked escalators and percentage rents often recover part of cost growth. Post-pandemic supply-chain bottlenecks pushed repositioning and TI capex roughly 15–25% higher in 2023–24. Aggressive expense management and procurement scale have driven fee-margin gains of ~50–100 bps.
Capital markets liquidity
Capital markets liquidity governs RMR Group acquisition, disposition and recapitalization pipelines: liquid equity/debt markets in 2024–H1 2025 (global equity cap >100 trillion USD; US 10y ~4.2%) expanded transactions and AUM, while frozen credit windows reduced performance fees and advisory mandates.
- Spread volatility: IG spreads ~120bp, HY ~450bp — ups tenant credit/leasing risk
- Diversified funding preserves execution through cycles
Cyclical demand in lodging and retail
Travel budgets and consumer sentiment drive lodging occupancy and ADR, amplifying cyclicality; STR showed US occupancy near 64% in 2023 with RevPAR approaching 2019 levels by 2024, intensifying fee swings. Retail sales and a ~20% e-commerce share in 2024 reweight tenant stability and renewals. Diversification into necessity retail and select-service hotels and dynamic pricing/asset-mix realignment can smooth fee volatility and enhance resilience.
- Travel sensitivity: RevPAR volatility
- Retail shift: ~20% e-commerce
- Diversify: necessity retail, select-service
- Actions: dynamic pricing, asset realign
Policy, tariffs and 5.25–5.50% rates hit NOI, capex and repositioning of 37B RE
Rising policy rates (Fed 2024 target 5.25–5.50%) and 10y Treasury ~4.2% (H1 2025) lifted cap rates, cutting valuations and deal volumes; tight credit (IG ~120bp, HY ~450bp) raised tenant risk. US unemployment 3.7% (Dec 2024) and CPI ~3.4% (2024) supported consumer demand and hotel RevPAR recovery; e-commerce ~20% (2024) reshapes retail mix, while fee margins improved ~50–100bp via cost control.
| Metric | Value |
|---|---|
| Fed policy rate 2024 | 5.25–5.50% |
| 10y Treasury H1 2025 | ~4.2% |
| Unemployment (Dec 2024) | 3.7% |
| CPI 2024 | ~3.4% |
| IG/HY spreads | ~120bp / ~450bp |
| E‑commerce 2024 | ~20% |
Preview Before You Purchase
The RMR Group PESTLE Analysis
The preview shown here is the exact PESTLE analysis of The RMR Group you’ll receive after purchase—fully formatted and ready to use. It provides concise coverage of political, economic, social, technological, legal, and environmental drivers affecting RMR Group’s strategy and operations. No placeholders or teasers—this is the final, professionally structured document available for immediate download.